Phase 2 propagation study¶
Reproduce: python studies/phase2_propagation.py (add --quick for a fast run). Every number
here comes from that script; raw output is in phase2-results.json, figures in figures/.
What this shows and does not show. This is measured on the ground-truth fake client, not a real model. It demonstrates that the M2 propagation mechanics behave as designed — bias weighted by blast radius, accumulated across execution — and quantifies the effect of where bias enters the graph. It is not a claim about real multi-agent systems.
Setup¶
A hub topology: root → hub → {w1, w2, w3, w4}. The hub fans out to four workers, giving it the
largest Katz blast radius; w1..w4 are terminal leaves. A seed node is given a fixed bias
(beta = 3.0) that amplifies as it propagates downstream (capped); every node is scored through the
real compute_local_bias → node_magnitude → Katz weight → NetworkAccumulator stack, one accumulator
update per topological superstep. B_net is the fast-scale network signal.
1. Same bias, central vs. leaf seed¶
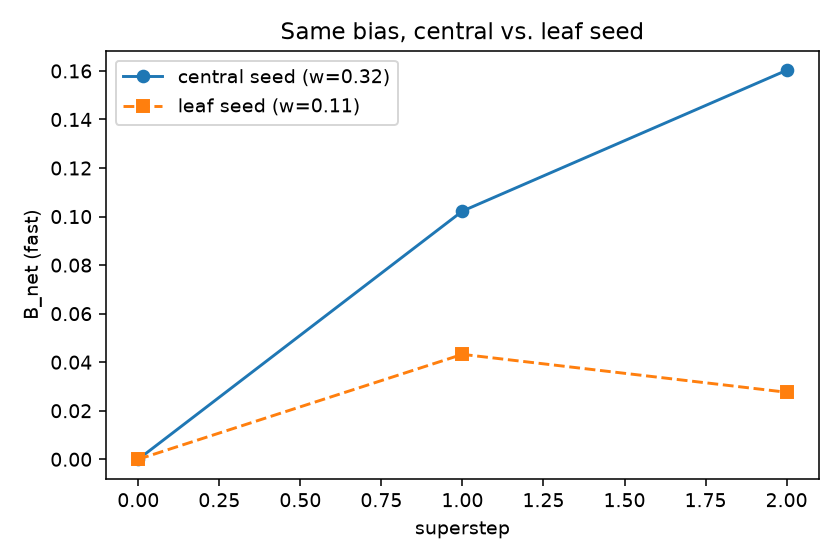
The headline result. Identical bias magnitude, seeded once at the central hub and once at the leaf
w1:
| Seed | Katz weight | Final B_net (fast) |
Trajectory |
|---|---|---|---|
hub (central) |
0.316 | 0.160 | 0.0 → 0.10 → 0.16 |
w1 (leaf) |
0.105 | 0.028 | 0.0 → 0.04 → 0.03 |
The same bias produces ~5.8× more network-level signal when it enters at a central node than at a
leaf. A biased leaf reaches nothing downstream and carries little weight, so B_net barely moves
and then decays; a biased hub contaminates all four workers and is weighted heavily, so B_net
climbs and stays up. This is the entire justification for topological weighting: a per-node bias
score is not actionable without knowing the node's blast radius.
2. B_net tracks blast radius¶
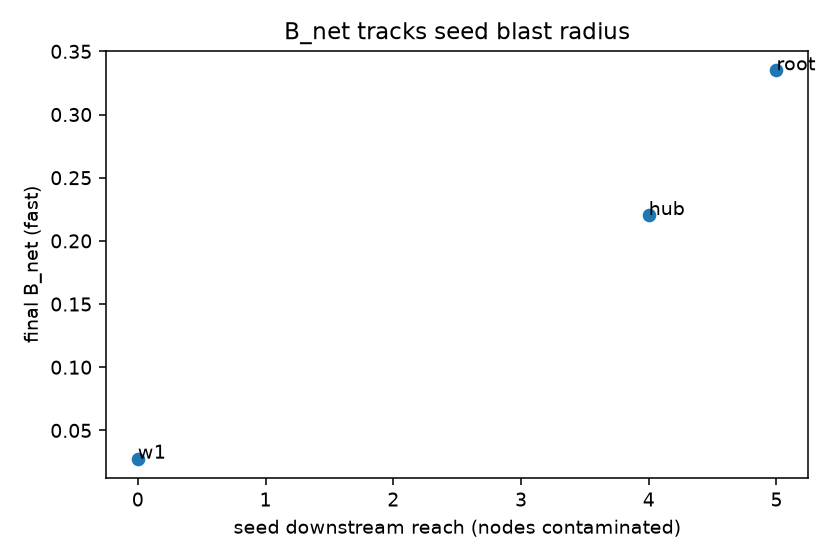
Seeding each of three positions of increasing downstream reach:
| Seed | Katz weight | Downstream reach | Final B_net |
|---|---|---|---|
w1 (leaf) |
0.105 | 0 nodes | 0.028 |
hub |
0.316 | 4 nodes | 0.220 |
root |
0.263 | 5 nodes | 0.335 |
B_net rises monotonically with the seed's downstream reach (0 → 4 → 5 nodes): a bias that can
contaminate more of the graph produces a larger network signal, as intended.
An honest nuance worth recording. The ordering by B_net (root > hub) does not match the
ordering by Katz weight (hub > root). Katz ranks hub above root because its α-discount (α=0.5)
penalizes root's more-distant leaves; but the harness amplifies bias to all reachable nodes
without that discount, so root — which reaches one more node than hub — accumulates more. This is
a real interaction between the weighting attenuation and the propagation model, not a bug: if you
want B_net ordering to track Katz weight exactly, the propagation decay and the Katz α have to be
aligned. It is flagged here as a calibration consideration for M3's threshold work.
3. Two timescales¶
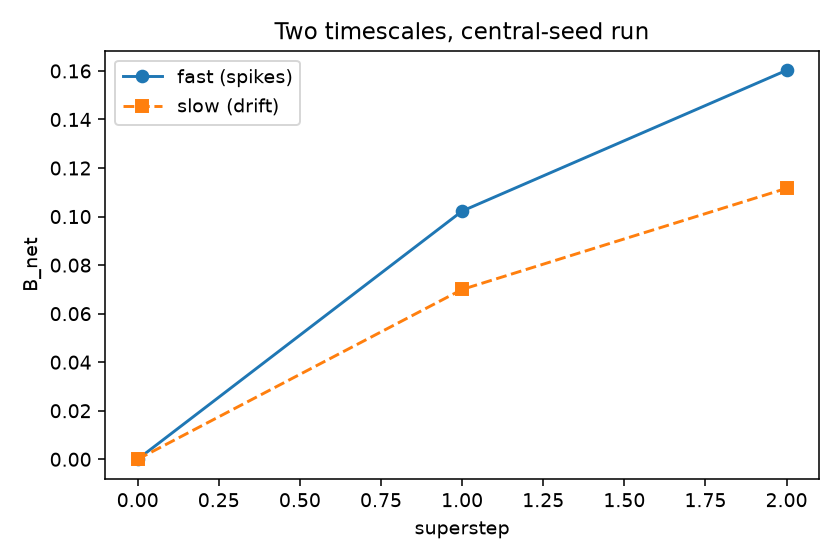
On the central-seed run, the fast and slow accumulators (α = 0.7 and 0.1):
| Superstep | fast | slow |
|---|---|---|
| 0 | 0.00 | 0.00 |
| 1 | 0.10 | 0.07 |
| 2 | 0.16 | 0.11 |
The fast scale leads — it reaches a higher level sooner as the bias spreads, which is what a spike detector should do; the slow scale lags, integrating the trend. Tripping on fast and drift-alerting on slow (an M3 concern) is what these two scales are for.
Takeaways for M3¶
- Blast-radius weighting works: identical bias is ~6× more impactful from a central node, and
B_nettracks downstream reach. A threshold onB_netis therefore meaningfully topology-aware. - The Katz-α / propagation-decay interaction (§2) means
B_net's absolute scale depends on both knobs; M3's threshold calibration should sweep them together rather than fixing one and tuning the other. - Fast and slow scales separate cleanly, supporting a two-threshold (spike vs. drift) breaker.